Global Temperature Data Underpins International Climate Negotiations
Submitting Institution
University of East AngliaUnit of Assessment
Earth Systems and Environmental SciencesSummary Impact Type
EnvironmentalResearch Subject Area(s)
Earth Sciences: Atmospheric Sciences, Geology, Physical Geography and Environmental Geoscience
Summary of the impact
Knowledge of the changing global temperature has contributed to an
international political agreement being reached about the over-arching
objective of climate change mitigation policies. The School's scientists
have made a crucial contribution to one of only three datasets that reveal
changes to the world's average temperature over the last 150 years. These
data have been central to each of the five Assessment Reports of the UN's
Intergovernmental Panel on Climate Change (IPCC), upon which successive
rounds of international climate change negotiations relied and which led,
in 2009, to the adoption of limiting global warming to 2 degrees Celsius
as an agreed international policy goal.
Underpinning research
The School's pioneering research in the area of climate reconstruction
began in the 1970s in the Climatic Research Unit (CRU, a part of the
School of Environmental Sciences) under Lamb (at UEA from
1972-1997), exploring evidence for climate change during historical time
recorded in instrumental, natural and documentary proxy records. More
recent work (Jones at UEA since 1976, Wigley 1975-2010, Briffa
since 1978 and Osborn since 1995) in this area has focussed on the
use of high-resolution climate proxies, prominent among them being the
analysis and interpretation of tree-ring data.
The School's instrumental temperature series are widely used as a
cornerstone in nearly all discussions about climate change, often in the
context of reconstructed changes in climate over the last one to two
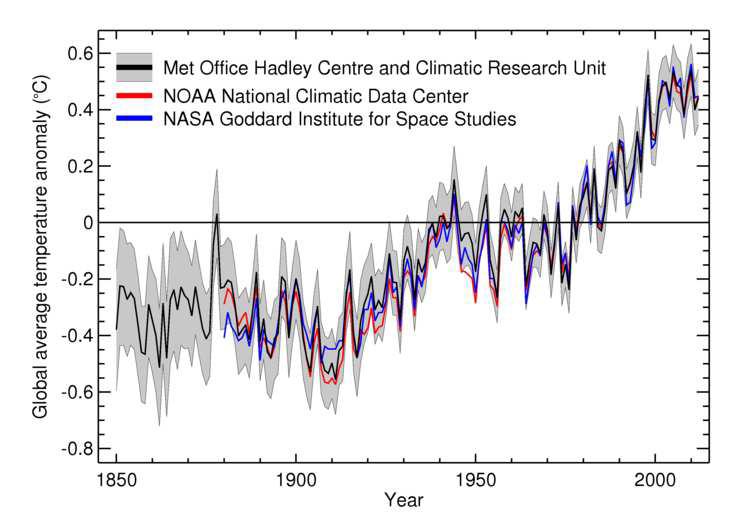
thousand years. Collaboration with the Met Office Hadley Centre (MOHC) has
led to the construction of one of only three global (land and marine)
temperature datasets in the world (currently named `HadCRUT4'). It is also
the longest established dataset having, for the first time in 1986,
combined global land and marine temperature reconstructions. The School
produces the land component (CRUTEM4) [1], and MOHC the marine component,
which are combined to form the global instrumental temperature dataset
HadCRUT4 (1850 to present day) [2]. Despite improvements in data
availability in many parts of the world, these new versions closely
resemble earlier versions, indicating the robustness of the series.
Differences between the newer and older versions are within the ranges of
error estimation, the techniques of which were first established in 1997
by School scientists (Jones, Osborn, Wigley, Briffa). An update of
the highly-cited dataset (CRU TS 2.1) [3] providing spatially-infilled and
high-resolution (0.5 by 0.5 degrees latitude/longitude) land grids of
temperature, precipitation, vapour pressure and cloud cover has recently
been completed (version 3.10). Several other datasets (circulation indices
such as the North Atlantic and Southern Oscillations) have been developed
through the critical analysis of instrumental records and are routinely
updated on the School's CRU website (http://www.cru.uea.ac.uk).
As evidenced by citation and download statistics, all the above datasets
are very widely used.
The School has been responsible for widely adopted methodological
advances in the field of past climate reconstruction [4] and has produced
multiple spatially-detailed and regionally-averaged reconstructions of
various climate parameters. The School is well known for its
reconstruction of mean summer temperature changes, extending over
centuries to millennia in different regions of the world. Scientists in
the School (Briffa, Jones and Osborn) have produced
[5], or contributed to, widely cited and utilised reconstructions of
average Northern Hemisphere temperature changes over the last 1,000 years,
some based solely on tree-ring data and others based on compendia of
multi-proxy sources.
Some scientific applications of these palaeo- and instrumental climate
datasets are specifically linked to climate models and their simulations
of future climate. It is through comparison of the instrumental and
palaeoclimate datasets with climate model simulations that climate models
are improved. More importantly though, the comparisons lead to Detection
and Attribution (D&A) studies where temperature changes in the past
are explained through the causes of climate change (the sun, greenhouse
gases, sulphate aerosols, volcanoes, etc). In 1996, School scientists (Jones
and Wigley) were the first to detect unusual warming in the
atmosphere (above the surface) and to attribute this to anthropogenic
causes [6].
References to the research
[UEA authors in bold] {citations from Scopus}
[1] Jones, P.D., Lister, D.H., Osborn, T.J., Harpham, C., Salmon, M.
and Morice, C.P. (2012) Hemispheric and large-scale land surface air
temperature variations: An extensive revision and an update to 2010. J.
Geophys. Res. 117, D05127, doi:10.1029/2011JD017139 {44};
Jones, P.D. and Moberg, A. (2003) Hemispheric and large-scale
surface air temperature variations: An extensive revision and an update to
2001. J. Climate 16, 206-223, doi:
10.1175/1520-0442(2003)016<0206.HALSSA>2.0.CO;2 {618}.
[2] Morice, C.P., Kennedy, J.J., Rayner, N.A. and Jones, P.D.
(2012) Quantifying uncertainties in global and regional temperature change
using an ensemble of observational estimates: the HadCRUT4 dataset. J.
Geophys. Res. 117, D08101, doi:10.1029/2011JD017187 {55};
Brohan, P., Kennedy, J., Harris, I., Tett, S.F.B. and Jones,
P.D. (2006) Uncertainty estimates in regional and global observed
temperature changes: a new dataset from 1850. J. Geophys. Res.
111, D12106, doi:10.1029/2005JD006548 {795}.
[3] Mitchell, T.D. and Jones, P.D. (2005) An improved
method of constructing a database of monthly climate observations and
associated high-resolution grids. Int. J. Climatol. 25, 693-712,
doi:10.1002/joc.1181 {1492};
Harris, I., Jones, P.D., Osborn, T.J. and Lister,
D.H. (2013) Updated high-resolution monthly grids of monthly
climatic observations: the CRU TS 3.10 dataset. Int. J. Climatol.
33, doi:10.1002/joc.3711 {19}.
[4] Briffa, K.R., Osborn, T.J., Schweingruber, F.H., Harris,
I.C., Jones, P.D., Shiyatov, S.G. and Vaganov, E.A. (2001)
Low-frequency temperature variations from a northern tree-ring density
network. J. Geophys. Res. 106, 2929 2941, doi:
10.1029/2000JD900617 {316}
[5] Jones, P.D., Osborn, T.J. and Briffa, K.R. (2001) The
evolution of climate over the last millennium. Science, 292, 662
667, doi: 10.1126/science.1059126 {283}
[6] Santer, B.D., Taylor, K.E., Wigley, T.M.L., Johns, T.C., Jones,
P.D., Karoly, D.J., Mitchell, J.F.B., Oort, A.H., Penner, J.E.,
Ramaswamy, V, Schwarzkopf, M.D., Stouffer, R.J. and Tett, S., 1996: A
search for human influences on the thermal structure of the atmosphere. Nature
382, 39-46, doi:10.1038/382039a0 {278}
Details of the impact
During the period 2008-2013 the world's governments have adopted an
agreed climate change mitigation policy goal of limiting global warming to
no more than 2 degrees Celsius above the pre-industrial average
temperature. This was first agreed at the 15th Conference of
the Parties to the UN Framework Convention on Climate Change (COP15) in
Copenhagen in December 2009 [7] and was confirmed at COP18 in Doha in
December 2012 [8]. (This goal had originally been adopted by the EU in
1996 and re-confirmed in 2007, and was also adopted by the G8 Summit in
July 2009). In agreeing this goal it was necessary to note that the
global-mean warming observed thus far had been 0.8°C — thus setting the
level of policy ambition necessary to limit further warming to no more
than 1.2°C. This `2 degree' policy goal is now guiding national (e.g. UK —
see [9]), European [10] and international efforts to negotiate and
implement a range of policy measures which will be effective and
sustainable.
In reaching this global agreement at COP15, after 15 years of
international negotiations, the world's governments relied upon (see [7],
[8]) the four successive assessment reports of the UN's IPCC, published in
1990, 1996, 2001 and 2007 (and the Fifth Assessment Report agreed in
September 2013). The global temperature datasets produced by the School
were and continue to be central to these IPCC Reports; in particular, the
HadCRUT3 dataset was used for the 2007 Report which guided the COP15
negotiations [11]. The importance of these data for the international
negotiations is shown by the fact that the UN World Meteorological
Organisation (WMO) brought forward its press release for the annual update
of these data to November/December, to coincide with the UNFCCC talks
being held at that time of year (e.g. WMO Press Release for the COP18 Doha
meeting [12]). This demonstrates that these data are vital for informing
decision-makers each year about the current state of world climate. The
work of the School — jointly with the Met Office Hadley Centre — in making
it possible to quantify and monitor the world's average surface
temperature has therefore directly contributed to this
internationally-agreed climate policy goal. Without these IPCC reports
being able to draw upon the School's work, very specifically upon
successive versions of the global temperature dataset, the importance of
addressing the dangers of anthropogenic climate change would be much less
well recognised and acknowledged by politicians and policy-makers around
the world. The impact of this work extends well beyond the IPCC and the
UNFCCC. The first diagram in many reports on climate change policy and
adaptation is the HadCRUT4 global temperature series (most recently by the
European Environment Agency [13]), and the update each year is headline
news in many media outlets. Indeed it is one of the most famous diagrams
in science.
The importance and significant impact of this work on national and
international climate policy and public engagement was vividly
demonstrated, but in a very different way, in November and December 2009.
Professional email correspondence between scientists in the School and
colleagues around the world was obtained illegally and made publicly
available via the internet. The subsequent controversy became known as `Climategate'
and revolved around a number of issues, but most critically whether the
School's temperature data (including reconstructed temperature data over
the last millennium) had been improperly manipulated. The importance of
this question, and hence the impact of the School's work in this area,
demanded a series of subsequent independent inquiries: by the House of
Commons Select Committee on Science & Technology; the Muir-Russell
Independent Climate Change Email Review; and the Oxburgh Scientific
Assessment Panel. All of these Inquiries unambiguously affirmed the
quality and reliability of the School's work — [e.g. 14].
The School's unique work on global temperature data has also had impact
on public awareness, political negotiations and policy development on
climate change through its widespread use in Detection and Attribution
(D&A) of climate change due to human activities. The scientific
community's efforts to reconstruct up to 2,000 years of past Northern
Hemisphere temperatures, in which the School has played a key role, helps
address a range of policy-relevant questions. Instrumental warming during
the 20th century is `clear and unequivocal' [11] and study of these longer
periods helps determine the unusualness of this warming in much longer
time sequences.
The School's datasets (HadCRUT4 and its precursor global temperatures,
Northern Hemisphere temperature proxies, and instrumental precipitation
data) have been used in almost all studies that have considered the
D&A problem. The Special Report on Extremes (SREX) of the IPCC
extended D&A to also consider the extremes of the climate as manifest
in temperature, precipitation and storm datasets [15] and again relied
upon the School's datasets. The School's datasets are widely used by many
less-developed governments around the world. Access is through the World
Bank [16], who have taken our `national' products for all UN countries and
recognized territories (developed in Ref [3] above) and extended the work
to additionally include all major river basins of the world.
Sources to corroborate the impact
[7] UNFCCC (2009) The
Copenhagen Accord Decision Chapter 15; paragraph 2 states:
"We agree that deep cuts in global emissions are required according to
science, and as documented by the IPCC Fourth Assessment Report with a
view to reduce global emissions so as to hold the increase in global
temperature below 2 degrees Celsius, and take action to meet this
objective consistent with science and on the basis of equity"
[8] UNFCCC (2012) Ad
hoc working group on long-term cooperative action under the Convention
"Decides that Parties will urgently work towards deep reduction of
global GHG emissions required to reach the below 2 degree goal and
global peaking [as soon as possible][by 2015], consistent with science,
such as IPCC AR4"
[9] HM Government (2013) Supporting
international action on climate change
This document quotes the rise in global temperature to date (0.8°C) based
on the HadCRUT4
dataset) and the policy goal of limiting this warming to 2°C: "The
industrial revolution led to an increase in greenhouse gas emissions
caused by human activity. The Earth's surface has consequently warmed by
about 0.8°C since around 1900, with much of this warming occurring in
the past 50 years."
[10] European Commission (2008) What
is the EU doing about climate change?
[11] IPCC (2007) Climate
change 2007: the physical science basis
"Gridded data sets combining land-surface air temperature and SST
anomalies have been developed and maintained by three groups: CRU with
the UKMO Hadley Centre in the UK (HadCRUT3 ..."
See also Table 3.3 for further evidence.
[12] WMO (2012) Press
Release No.966: Record Arctic sea-ice melt, multiple extremes and
high temperatures
This press release contains the figure below:
[13] European Environment Agency (2012) Climate
change, impacts and vulnerability in Europe 2012
See: pages 57-59
[14] Report
of the International Scientific Assessment Panel set up under Lord
Oxburgh to examine the research of the Climatic Research Unit. See: p 4:
"We believe that CRU did a public service of great value by carrying
out much time-consuming meticulous work on temperature records at a time
when it was unfashionable and attracted the interest of a rather small
section of the scientific community. CRU has been among the leaders in
international efforts in determining the overall uncertainty in the
derived temperature records and where work is best focussed to improve
them."
[15] IPCC (2012) Managing
the risks of extreme events and disasters to advance climate change
adaptation A Special Report of Working Groups I and II of the
Intergovernmental Panel on Climate Change
See: Chapter 3, pp 109-230, e.g. see p127; P.D Jones is cited 16 times in
this Chapter
[16] World Bank Climate change knowledge portal: for development
practitioners and policy-makers http://sdwebx.worldbank.org/climateportal/index.cfm
The Climatic Research Unit at the University of East Anglia is
acknowledged as the source of the climate data:
http://sdwebx.worldbank.org/climateportal/index.cfm?page=why_climate_change