Methods for Comparing Clinical Outcomes across Institutions
Submitting Institution
University of CambridgeUnit of Assessment
Mathematical SciencesSummary Impact Type
PoliticalResearch Subject Area(s)
Mathematical Sciences: Statistics
Medical and Health Sciences: Public Health and Health Services
Economics: Applied Economics
Summary of the impact
This case study concerns the research of Professor David Spiegelhalter on
`funnel plot' methodology for comparing institutions. This system has now
become the standard method within the National Health Service for
comparing clinical outcomes, including hospital Trusts with apparently
`outlying' mortality rates. In particular, mortality following children's
heart surgery is analysed and presented using funnel plots, and Professor
Spiegelhalter's work has been instrumental in handling high-profile cases
such as surgery at Oxford Radcliffe Infirmary and Leeds General Infirmary.
Underpinning research
Professor Spiegelhalter joined the Medical Research Council (MRC)
Biostatistics Unit at Cambridge in 1981, was returned as Category C in
subsequent RAEs was appointed Professor for the Public Understanding of
Risk in the Department of Pure Mathematics and Mathematical Statistics at
the University in 2007. Since 2003 he researched appropriate graphical
methods for comparing institutions, in particular the funnel plot, which
presents a set of performance measures versus their precisions, with added
control limits around a target value. Spiegelhalter's highly-cited 2005
paper has become the definitive text on this topic [1]. The control
limits, generally set at 2 and 3 standard deviations (95% and 99.8%
intervals) create a `funnel', visually emphasising that we can expect more
variability in smaller institutions. Dating back to early work on control
charts by Shewhart in the 1930s, traditionally a 3 standard-deviation
funnel has been used to identify `special-cause' variation (although the
NHS Information Centre currently display 2 standard-deviation limits).
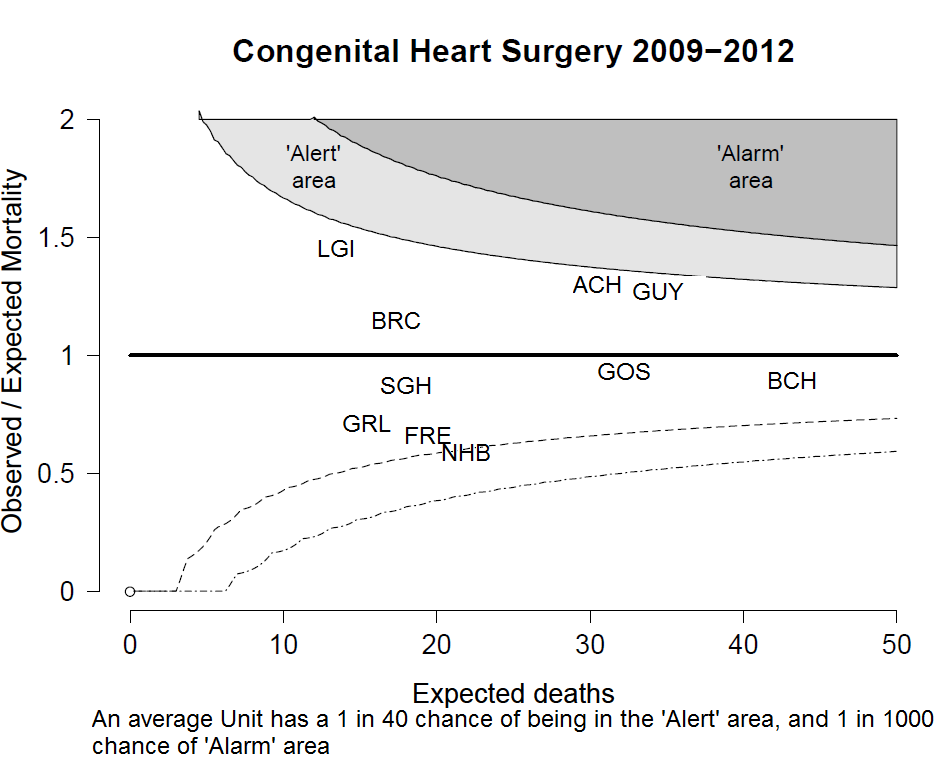
Basic funnels can be based on simple outcome rates assuming a Binomial
distribution. More sophisticated versions incorporate allowance for
different case-mix by producing a risk-adjusted Expected mortality rate:
the funnel is then based on the standardised mortality rate
(Observed/Expected), with limits based on a Poisson model. An additional
refinement, unique to Spiegelhalter's model, is the allowance for
`over-dispersion' — that is a degree of permissible variability in
underlying risk that is intended to take into account the inevitable
limitation in risk adjustment [2]. This has the effect of producing a
funnel that does not narrow indefinitely as the volume increases, but
tends to parallel control limits.
Example Funnel Plot, taken from [Source 4]:
In collaboration with members of the MRC Biostatistics Unit,
Spiegelhalter determined how to deal with multiple comparisons, and
critiqued a technique now often used in US health monitoring [3-4]. This
research, and its application to comparing NHS Trusts, was summarised in a
Royal Statistical Society discussion paper [5], with collaborators from
the Care Quality Commission and other institutions.
References to the research
* [1] D J Spiegelhalter. Funnel plots for comparing institutional
performance. Statistics in Medicine, 24:1185-1202, 2005,
DOI: 10.1002/sim.1970.
[2] D J Spiegelhalter. Handling over-dispersion of performance
indicators. Quality Safety Health Care, 14:347-351, 2005,
DOI: 10.1136/qshc.2005.013755.
* [3] HE Jones, DI Ohlssen, and DJ Spiegelhalter. Use of the false
discovery rate when comparing multiple health care providers. J Clin
Epidemiol, 61:232-240, 2008, 10.1016/j.jclinepi.2007.04.017.
[4] Jones HE and Spiegelhalter DJ. The identification of `unusual'
health-care providers from a hierarchical model. American Statistician, 65
: 154-163, 2011, DOI: 10.1198/tast.2011.10190
* [5] Spiegelhalter DJ, Sherlaw-Johnson C, Bardsley M, Blunt I, Wood C
and Grigg O. Statistical methods for healthcare regulation: rating,
screening and surveillance (with discussion). J Roy Statist Soc Series
A, 175, 1-47, 2012, DOI: 10.1111/j.1467-985X.2011.01010.x
*References which best represent the quality of the underpinning research
Details of the impact
Spiegelhalter's funnel plot methodology has been adopted by numerous
organisations charged with communicating medical outcomes to the public,
and has become increasingly influential in recent years with growing
public concern resulting from the release of evidence of certain NHS
performance outcomes.
A major application area has been in child heart surgery. The National
Institute for Cardiovascular Outcomes Research (NICOR) uses funnel plots
to communicate risk of surgery for congenital heart disease to the public
[6]. In addition they have strongly featured in Inquiries into possible
performance failures in UK hospitals: based on his research in this area,
Professor Spiegelhalter was a member of the 2010 Inquiry into child heart
deaths at the Oxford Radcliffe Infirmary, which resulted in the ceasing of
surgery in Oxford. In 2012 he also contributed funnel-plot analysis [7] to
the controversial Safe and Sustainable [8] programme that
recommended closure of centres for paediatric heart surgery. In April
2013, at the height of the controversy surrounding surgery at Leeds
General Infirmary, Professor Spiegelhalter was part of the group analysing
the revised data and he produced funnel plots to communicate the findings
— this analysis contributed to the decision to restart surgery at Leeds.
[9]
As a result of Spiegelhalter's research, funnel plots have become a
standard method used for comparing outcomes within the National Health
Service: Department of Health guidance on `Detection and management of
outliers' [10] is almost entirely based on Spiegelhalter's work. The
National Joint Registry [11] uses them to identify centres with poor rates
of knee-replacement problems, while Organ Donation compares kidney
transplant success rates between centres. The initiative in 2013 to
publish surgeon-specific outcome data makes extensive use of funnel plots,
which appeared in news coverage [12]. The NHS Information Centre uses
funnels as part of their reports on "Summary Hospital-level Mortality
Indicator (SHMI) — Deaths associated with hospitalisation, England" [13]
on an annual basis, including allowance for over-dispersion. Following the
Mid-Staffordshire Inquiry (at which Professor Spiegelhalter was a
witness), this information is used to select hospitals for further
investigation.
Funnel plots have been included in software distributed by the Eastern
Region Public Health Observatory (now part of Public Health England): a
training video has been produced and 6500 downloads have been reported.
[14]
Sources to corroborate the impact
Use of funnels by NICOR
[6] https://nicor4.nicor.org.uk/CHD/an_paeds.nsf/WBenchmarksYears?openview&RestrictToCategory
=2010&start=1&count=500
Response to analysis of Mortality data NHS Trust in England providing
paediatric cardiac surgery 2000-2009
[7] http://www.specialisedservices.nhs.uk/library/30/Appendix_F___Response_to_the_analysis_of_Mortality_Data_of_NHS_Trust_in_England_Providing_Paediatric_Cardiac_Surgery_2000___2009_including_Terms_of_Reference.pdf
"Safe and Sustainable" documents reporting analysis based on funnel
plots:
[8]
http://www.specialisedservices.nhs.uk/news/view/response-to-south-central-sha-analysis-outcome-data
Report on children's heart surgery in Leeds
[9] http://www.england.nhs.uk/2013/04/12/reports-chs-leeds/
Department of Health Guidance on handling outliers
[10]
https://www.gov.uk/government/publications/detection-and-management-of-outliers-guidance-prepared-by-national-clinical-audit-advisory-group
National Joint Registry and 2012 Annual Report
[11] http://www.njrcentre.org.uk/njrcentre/default.aspx
BBC News web-page showing funnel plot to display mortality rates for
vascular surgeons
[12] http://www.bbc.co.uk/news/uk-politics-22489062
Details of methodology used by NHS
[13] http://www.ic.nhs.uk/CHttpHandler.ashx?id=11151&p=0
[14] Download information: email from Director of Knowledge and
Intelligence Knowledge and Intelligence Team (East), Public Health England