Multi-country risk-mapping leads to more efficient delivery of mass-treatment for the control of river blindness
Submitting Institution
Lancaster UniversityUnit of Assessment
Allied Health Professions, Dentistry, Nursing and PharmacySummary Impact Type
HealthResearch Subject Area(s)
Mathematical Sciences: Statistics
Medical and Health Sciences: Cardiorespiratory Medicine and Haematology, Public Health and Health Services
Summary of the impact
Onchocerciasis (river blindness) is a debilitating disease of major
public health importance in the
wet tropics. The African Programme for Onchocerciasis Control (APOC) seeks
to control or
eliminate the disease in 19 countries. Accurate mapping of Loiasis
(eye-worm) was a requirement
for implementation of APOC's mass-treatment prophylactic medication
programme in order to
mitigate against serious adverse reactions to the Onchocerciasis
medication in areas also highly
endemic for Loiasis. Model-based geostatistical methods developed at
Lancaster were used to
obtain the required maps and contributed to a change in practice of APOC
in a major health
programme in Africa. Our maps are used to plan the delivery of the
mass-treatment programme to
rural communities throughout the APOC countries, an estimated total
population of 115 million.
Underpinning research
Diggle (Distinguished Professor of Statistics) has been an academic at
Lancaster throughout the
period described in this impact case study and has been the lead
researcher for the research
underpinning this case study.
From 1995 onwards Diggle and colleagues were responsible for developing a
novel model-based
approach to geostatistical analysis and promoting its usage amongst
epidemiologists, geographers
and statisticians (Ref. 3.1). This model-based approach represents a major
paradigm-shift from
classical geostatistics, by importing efficient, principled methods of
predictive inference rather than
relying on the more ad hoc approaches used in classical geostatistics.
Control efforts against
onchocerciasis are co-ordinated by APOC (5.1) and include mass
administration of drugs to kill
Onchocerca volvulus, a worm parasite responsible for the severely
debilitating condition river
blindmess. The drug of choice for treatment is ivermectin (Mectizan®
donated to APOC by Merck,
5.2), which kills the immature worms but due to the long-lived nature of
the adults needs to be re-
administered on an annual basis. However, a different parasitic worm, the
eye-worm Loa loa,
which has a partially overlapping distribution, is also killed by
ivermectin, but treatment of
individuals with heavy eye-worm infections can produce severe side
effects.
Supported by grant-funding from WHO (3.6), Diggle and co-workers applied
model-based
geostatistical methods to produce a spatial risk map for Loaiasis
prevalence in Cameroon and
immediately surrounding areas, using parasitological (blood-sample) data
from field-studies
conducted by APOC field epidemiologists, in combination with remotely
sensed data on
environmental risk-factors (3.2). This provided key planning information
for APOC to address this
problem for the first time, putting in place precautionary measures and
not providing mass
administration in affected areas, but proceeding with confidence
elsewhere. Further statistical
research extended the methodology to include bivariate geostatistical
modelling, enabling a more
fine-grained mapping application to be developed and improving the
precision of the drug
administration programme (3.3). With MRC support (3.7) the bivariate model
was then used to
calibrate parasitological prevalence data against a safer, lower-cost,
questionnaire-based
instrument for estimating prevalence (3.4) thus potentially further
improving the effectiveness of the
APOC programme. This was realised in further research where the
calibration relationship was
extended to mapping all of the 19 participating APOC countries, using only
questionnaire-based
data (3.5). Following this research, the WHO policy for the prophylactic
medication programme has
now to put in place precautionary measures against serious adverse
reactions to the medication in
areas where Loiasis prevalence exceeds 40% as measured by the
questionnaire-based
instrument. The conventional mapping methods previously in use only give
point estimates of
prevalence and are ill-suited to this purpose. In contrast, model-based
geostatistics enables the
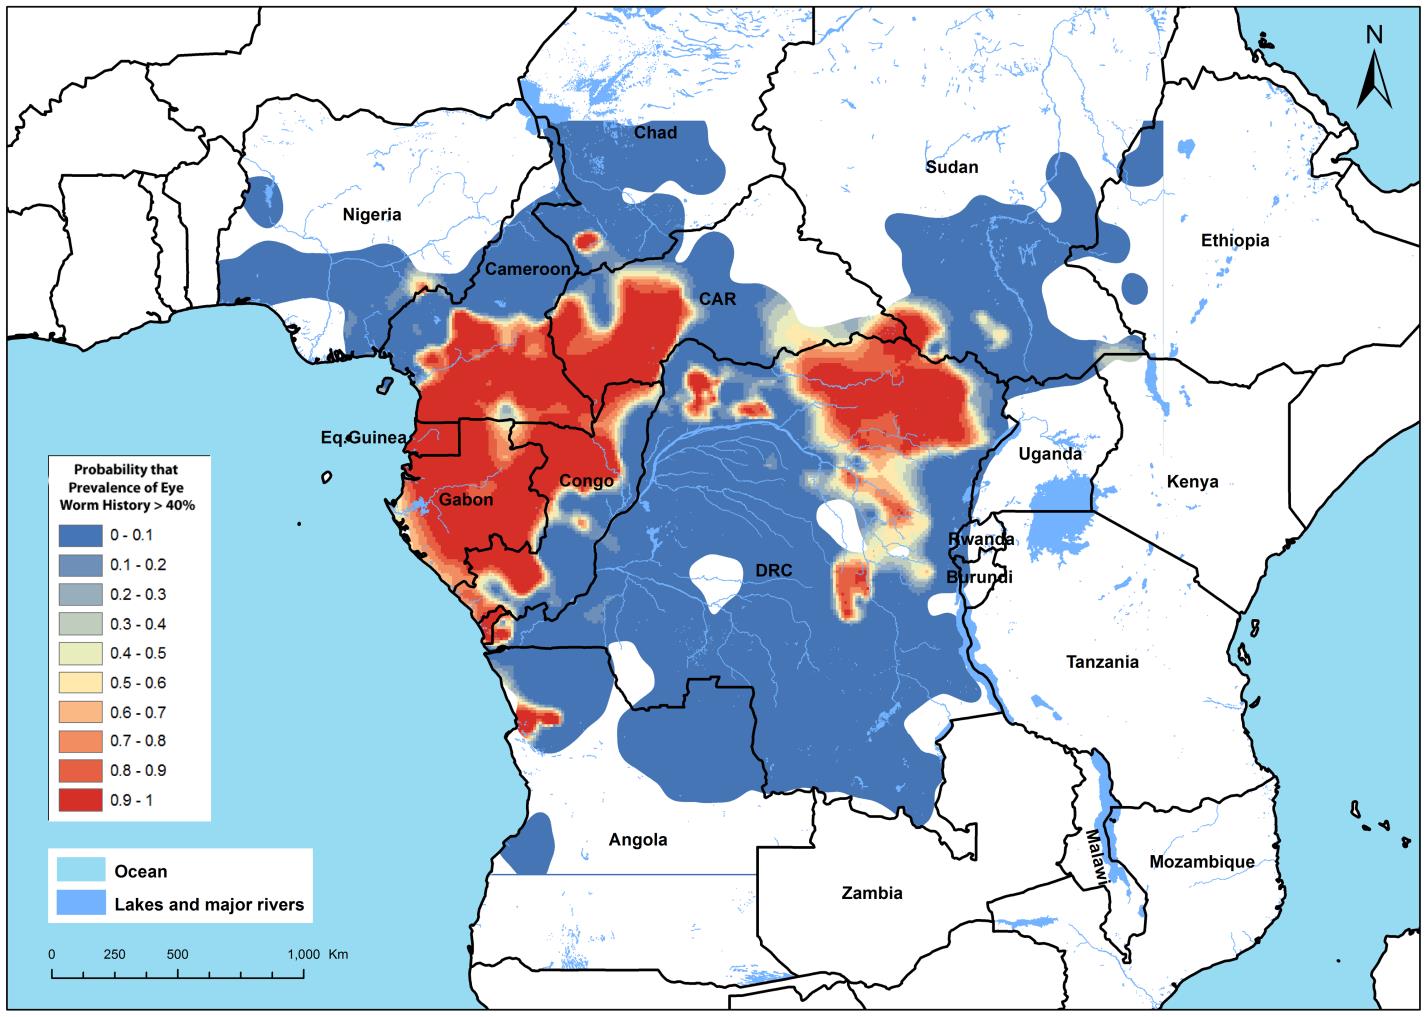
construction of probabilistic risk-maps. An example of the data produced
is captured in the map
shown in Figure 1, which demarcates the study-region into areas where the
true prevalence is
above (red) or below (bright blue) the 40% policy intervention threshold
with probability at least 0.9,
and a corridor of uncertainty where more data are needed to make an
accurate prediction.
This case-study is only one of many examples of how model-based
geostatistical methods are
used for converting spatially sparse data into spatially continuous maps
with associated estimates
of precision. The methodology is well-suited to disease mapping
applications in resource-poor
settings where registry data are not available.
 Figure 1. Loiasis (eye-worm) risk-map. The mapped variable is the
predictive probability that
Loiasis prevalence as determined by questionnaire exceeds 40%, defined by
WHO to be "high
risk." Areas coloured red have high probability (>0.9) of the true
prevalence exceeding 40%, areas
coloured bright blue a low probability (<0.1). Pink, cream and light
blue areas denote intermediate
probabilities as indicated on the legend. (From reference 3.5).
References to the research
Publications
3.1 Diggle, P.J., Moyeed, R.A. and Tawn, J.A. (1998). Model-based
geostatistics (with Discussion).
Applied Statistics, 47, 299-350. doi:
10.1111/1467-9876.00113. On 27/10/2013, Google scholar
listed 957 citations.
3.2 Diggle, P.J., Thomson, M.C., Christensen, O.F., Rowlingson, B.,
Obsomer, V., Gardon, J.,
Wanji, S., Takougang, I., Enyong, P., Kamgno, J., Remme, H., Boussinesq,
M. And Molyneux,
D.H. (2007). Spatial modelling and prediction of Loa loa risk: decision
making under uncertainty.
Annals of Tropical Medicine and Parasitology, 101, 499-509.
doi: 10.1179/136485907X229121.
3.3 Crainiceanu, CM, Diggle, PJ and Rowlingson, B (2008) Bivariate
binomial spatial modelling of
Loa loa prevalence in tropical Africa (with Discussion). Journal
of the American Statistical
Association, 103, 21-43. doi: 10.1198/016214507000001409.
Submitted in REF2.
3.4 Wanji, S., Akotshi, D.O., Kankou, J.M., Mutro, M.N., Tepage, F.,
Ukety, T.O., Diggle, P.J. and
Remme, J.H. (2012). Validation of the rapid assessment procedures for
loiasis (RAPLOA) in the
Democratic Republic of Congo: health policy implications. Parasites
and Vectors 5, 25
doi:10.1186/1756-3305-5-25.
3.5 Zoure, H., Wanji, S., Noma, M., Amazigo, U., Diggle, P.J., Tekle, A.
and Remme, J.H. (2011).
The geographic distribution of Loa loa in Africa: results of large-scale
implementation of the Rapid
Assessment Procedure for Loiasis (RAPLOA). Public Library of Science:
Neglected Tropical
Diseases, 5, (6): e1210. doi:10.1371/journal.pntd.0001210.
Grants
3.6 2005, $80,000 from WHO to Prof Peter J Diggle, for "Calibration
and Mapping of
Parasitological and RAPLOA estimates of Loa loa Prevalence".
3.7 2010-2013, £484,968 (FEC) from MRC to Prof Peter J Diggle and Mr
Barry Rowlingson for
"Statistical modelling for real-time spatial surveillance and
forecasting".
Evidence of the quality of the research
All the underpinning research is original and has been published in
peer-reviewed journals. As a
measure of the significance of the research, total funding since 2005
amounts to some £500,000
and was obtained in open competition.
Details of the impact
Following the original methodological work (3.1), Diggle led the
development of an open-source R
package (geoR, http://cran.freestatistics.org/)
to implement model-based geostatistical methods so
as to facilitate their adoption by applied scientists. This led to a
collaborative project with the
Liverpool School of Tropical Medicine, which in turn led to Diggle being
invited to join an
international oversight group (the Mectizan Expert Committee) advising the
African Programme of
Onchocerciasis Control (APOC) in the roll-out of a multi-country
mass-distribution programme of
prophylactic medication against onchocerciasis (river blindness), and
subsequently to working
directly with APOC scientists in Burkina Faso and at WHO Tropical Diseases
Research in Geneva
(5.1,5.2,5.3).
The APOC programme has been running since 1995, spans 19 African
countries and has
generally been very successful, having administered approximately 70
million treatments to date,
with a target of reaching 90 million treatments by 2015 (5.4, 5.5).
However, the programme
encountered a problem when it was discovered that people heavily
co-infected with Onchocerca
and Loa parasites were at risk of a severe (occasionally fatal)
adverse reaction to the prophylactic
medication. As a result, the programme needed to obtain an accurate map of
Loiasis prevalence
across the 19 APOC countries. In the absence of reliable census
information, this required a major
effort in the collection of prevalence data from field surveys and its
integration with remotely
sensed proxies for environmental risk-factors, using model-based
geostatistical methods. The
modelling problem was further complicated by the need to combine two
different survey
instruments: a "gold standard" parasitological (blood-sample-based)
instrument available at several
hundred locations, and a questionnaire-based instrument that could be
collected at several
thousand locations throughout the 19-country target region. This required
an extension of the
original methodology, reported in references 3.3 and 3.4. This methodology
was then used to map
prevalence throughout the APOC region (3.5). Dissemination of these ideas
to the user-community
was achieved by Diggle making successive presentations to annual meetings
of APOC's Technical
Consultative Committee in Burkina Faso, attended by scientific and
administrative representatives
of the participating countries (5.6). As a result, model-based
geostatistical methods have now been
adopted for decision making and prevalence mapping throughout the region
covered by the APOC
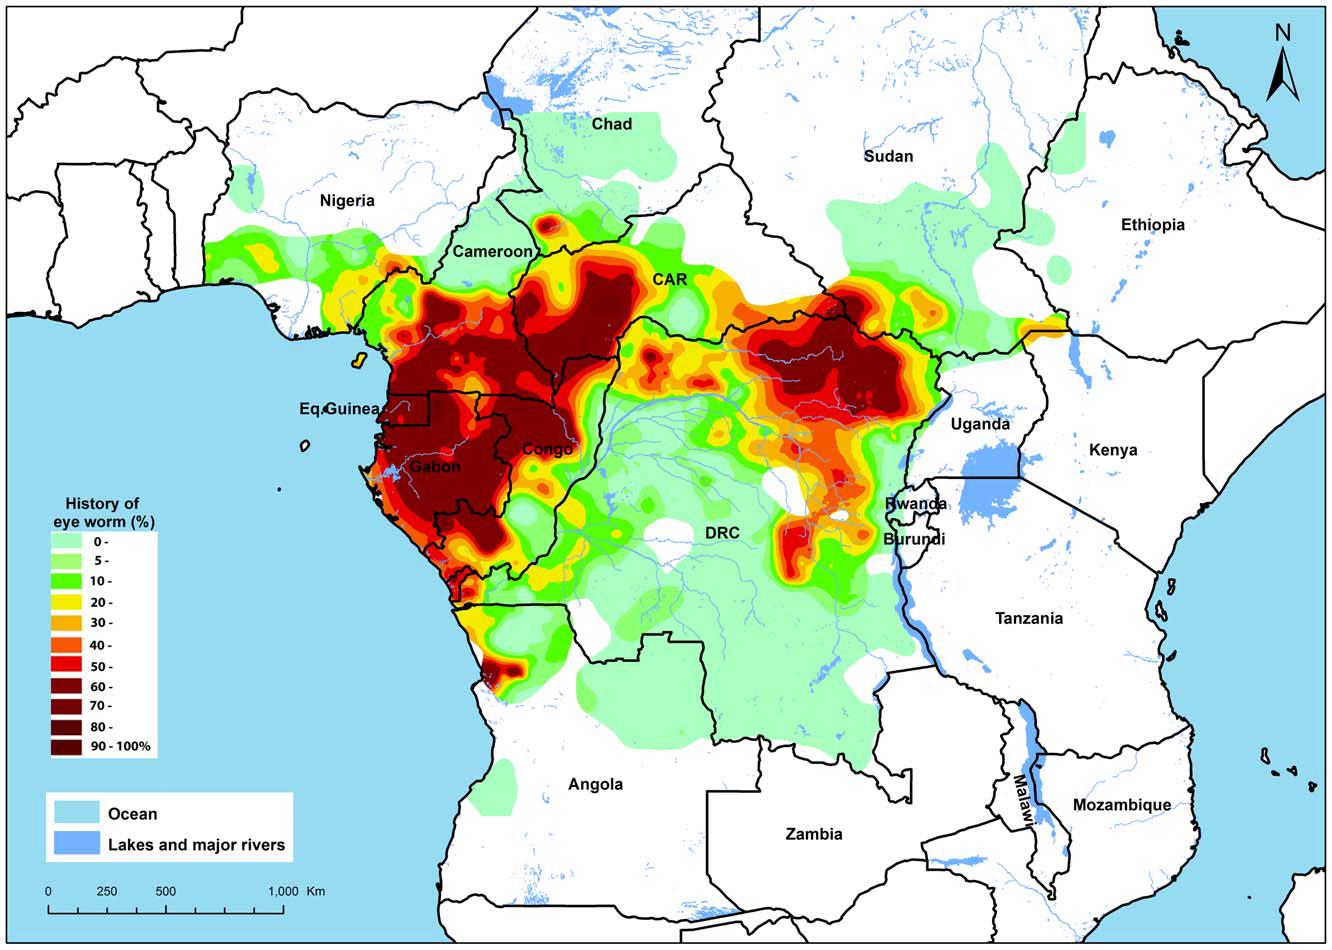
member-countries, for example, the map below from "Fifteen Years of APOC"
(Fig. 2, 5.7).
Specifically, APOC has adopted a policy of putting in place appropriate
precautionary measures
before implementing mass-treatment in areas where questionnaire-based
Loiasis prevalence is
thought to exceed 40%. The model-based approach delivers maps that show,
at each location, the
predictive probability that local prevalence exceeds this 40% threshold,
conditional on all of the
available data.
The research has changed APOC's practice with regard to implementation of
the mass-treatment
programme in areas highly endemic for Loiasis (5.8) and, through this, has
been of indirect benefit
to all rural communities throughout the 19 APOC countries, an estimated
total population of around
115 million (5.4). Prior to implementation of the APOC programme in some
areas up to 50% of
adults suffered from blindness, but by 2005 the number of
disability-adjusted life years (DALYs)
lost to onchocerciasis had been reduced by 50%. With the help of Prof
Diggle's research and
continued efforts on the ground further reductions in DALYs are occurring,
the prediction is that this
will be reduced by 86% by 2015 (5.4), As the current Director of APOC
states "Prof Diggle's input,
using his model-based geostatistical methodology, has been an essential
contribution to the APOC
programme" (5.8). The impact is continuing, since publication of the
first prevalence maps in reference
3.2. Prof Diggle's work has also been cited by HEFCE as an effective use
of QR funding in delivering
impact (5.9).
 Figure 2. Map of the estimated prevalence of eye worm history in Africa.
Map reproduced in
"Fifteen Years of APOC" (5.7) from reference 3.5.
Sources to corroborate the impact
5.1 Professor of Tropical Health Sciences, Liverpool School of Tropical
Medicine
5.2 WHO Scientist, WHO Tropical Disease Research
5.3 Former Director, African Programme for Onchocerciasis Control
5.4 African Programme for Onchocerciasis Control
http://www.who.int/blindness/partnerships/APOC/en/
5.5 Mectizan Donation Program http://www.mectizan.org/
5.6 Report of the 29th session of the Technical Consultative
Committee (TCC) Ouagadougou, 14-
19 September 2009
http://www.who.int/apoc/about/structure/tcc/TCC29_FINAL_REPORT_Eng.pdf
(page 16, para 69)
5.7 Fifteen years of APOC, 1995-2010
http://www.who.int/apoc/magazine_final_du_01_juillet_2011.pdf,
(page 21)
5.8 Letter from Director of APOC
Collaborative work between APOC and Prof Diggle Statement.pdf
5.9 Securing world-class research in UK universities: Exploring the
impact of block grant funding.
HEFCE publication (case-study, page 6)
http://www.hefce.ac.uk/media/hefce/content/whatwedo/research/howwefundresearch/QR.pdf